
 Profile
 Dashboard
 Logout
Table of contents
Key takeaways
- Judge product page conversion against a benchmark with the same goal and denominator.
- Category, traffic source, device mix, price, visitor intent, and the conversion goal all shape the rate.
- Product videos can help when they answer a question left after shoppers read the copy and view the photos.
What is a good product page conversion rate?
There is no single conversion rate that makes every product page a strong performer. Shopify’s ecommerce benchmark guide discusses storewide purchase rates, which should not be treated as product page benchmarks without checking the denominator.
Start with the calculation: transactions divided by product page sessions, multiplied by 100. Thirty orders from 1,500 sessions equals a 2% rate.
B2B SaaS pages may count a demo request or trial signup rather than a purchase. Unbounce reports a 3.8% median for SaaS landing pages, but that is a landing page benchmark, not a universal product page rate.
Category, traffic source, device mix, price, and visitor intent all affect the rate. A search visitor may be closer to buying than someone arriving from a social ad.
Compare the same page type, conversion goal, and session definition with a benchmark or an earlier period. Otherwise, the measurement may have changed.
Why do product page benchmarks vary so much?
Category, traffic source, device mix, price, visitor intent, and the conversion goal all shape the rate. The denominator matters. An expensive item may take several visits to sell, while a low cost refill can convert on one product page visit.

Visitors from product search may arrive with more buying intent than people opening a social ad. Device mix shifts the result too. Check phone and desktop separately instead of relying on one blended dashboard number.
Purchases, demo requests, free trial signups, and downloads aren’t interchangeable conversions. Each rate needs a clear numerator and denominator. For purchases, that could be completed orders divided by product page sessions; compare it only with a benchmark using the same definition. A demo request rate based on form submissions and page visits answers a different question.
Check that the purchase event fires on the order confirmation page, not when someone adds an item to the cart. That mix up inflates the rate. Define the event before comparing results.
Where can product videos help shoppers convert?
Product videos can help when they answer a question left after shoppers read the copy and view the photos. A video can show how a fabric drapes or how an appliance works. Match it to a real buying question; it won’t help every product or page equally.

Keep the page basics in place. Show customer reviews, several clear product images, and shipping costs before checkout. Video can add page weight, so check loading and responsiveness against Google Web Vitals guidance.
On a phone, the play control must not cover the add to cart button. Check it on the actual screen, not just in a desktop preview.

Use the page’s own baseline to judge results. Track the same conversion event on the same page type, and note changes to traffic sources or promotions during the test. If a stronger review section or shipping update goes live alongside the video, the cause of any change is unclear. Change one thing at a time where practical, then check the page on mobile before publishing.
How to add a CompleteGreet video to a product page
Pick one product page where shoppers often need help with a feature, size, or setup step. Start small.
Record a short greeting that answers that question, then show the relevant detail on camera. Keep the script about the item, not the whole store. One confusing feature is enough to give shoppers a reason to press play.
Place the bubble where shoppers can find it without covering the price, variant selector, or add to cart button. CompleteGreet can show a bubble on specific URLs, so it can be set to the product page rather than every page in the store.
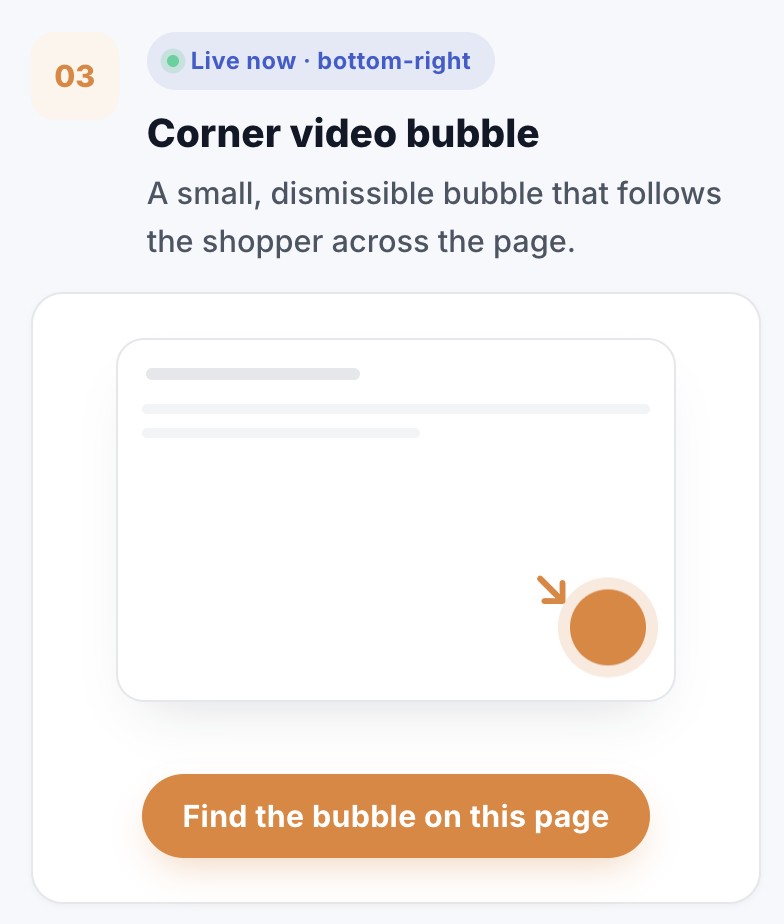
Check the page on a phone before publishing. Open the variant picker and add to cart button with the bubble visible. If either is covered, adjust its position or display timing.
Record the current product page conversion rate, then compare it with the rate after adding video. Keep the measurement window and traffic sources consistent. Check video plays as well as purchases.
FAQ
How is product page conversion rate calculated?
Divide transactions by product page sessions, then multiply by 100.
How do you choose a fair benchmark?
Compare pages with similar products, traffic sources, devices, and purchase intent. A storewide rate may hide useful differences.
How should video be evaluated?
Compare with the page’s own baseline. Track purchases alongside video plays, and don’t credit video for a lift if other page changes went live at the same time.
Product page conversion benchmarks offer a reference point, not a universal target. The figures depend on what counts as a conversion and which visitors reach the page.
Product page conversion rate = transactions divided by product page sessions, multiplied by 100.
Storewide ecommerce purchase rates and SaaS landing page conversion rates measure different journeys. Neither establishes a universal product page benchmark.
These ranges aren’t directly comparable when conversion goals differ. Purchases, demo requests, free trial signups, and downloads each reflect different visitor intent, so compare pages with the same goal and denominator.
Category, traffic source, device mix, product price, and visitor intent can all shift results. Treat benchmarks as directional and assess page changes against the page’s own baseline.
A benchmark is useful only when the measurement stays consistent before and after a change. Record product page sessions and transactions for the same period before comparing results with a benchmark that uses those definitions.
Common questions
How do I calculate product page conversion rate for an ecommerce store?
Divide the number of completed transactions from product page sessions by the total number of product page sessions, then multiply by 100. For example, 30 transactions from 1,000 sessions equals a 3% conversion rate. Keep the reporting period and transaction definition consistent, especially if analytics tools count orders differently.
What is a good product page conversion rate for an ecommerce store?
A useful benchmark matches your conversion goal and uses the same denominator. Storewide ecommerce averages do not establish a typical product page rate. Category, traffic source, device mix, product price, and shopper intent can all shift the rate.
How do I choose a fair product page conversion benchmark?
Compare pages with the same goal and a similar audience. Ecommerce purchases should be compared with ecommerce purchases, not with B2B SaaS pages that measure demo requests or trial signups. Match the category, traffic source, device mix, and price range where possible, and use product page sessions as the denominator for purchase conversion.
How can I tell if a product video improves my product page conversion rate?
Compare the page’s conversion rate before and after adding video, using the same calculation and similar traffic conditions. Give the change enough time to collect a useful number of sessions, and check mobile and desktop separately if their results differ. Reviews, product images, shipping costs, and page speed can affect the same rate, so avoid crediting video for every change.
What conversion results have businesses measured with CompleteGreet video greetings?
We do not have substantiated figures for a general increase in enquiries, bookings, conversion rate, or time on site. Evaluate your own implementation using a defined conversion event, a consistent reporting period, and a comparable baseline.
How quickly can I add a CompleteGreet video greeting to a product page?
Setup time depends on your platform and whether your video is ready. Start with one product page, record a short greeting that answers a real shopper question, place it where visitors can find it, and check the page on a phone. Record the existing conversion rate first so the new version has a useful baseline for comparison.