 Profile
 Dashboard
 Logout
Table of contents
Key takeaways
- CompleteGreet’s public case studies report customer engagement gains of 43% to 70%, time on site gains of 21% to 33%, and conversion lifts of 17% and 19% across different implementations.
- Video views, play rates, and click counts are useful, but they mean more when you connect them to purchases, bookings, or qualified leads.
- A basic video greeting is easier to record, upload, and publish when the message is already clear.
What does the case data show?
CompleteGreet’s public case studies report different metrics for six implementations. Customer engagement gains range from 43% to 70%, time on site gains from 21% to 33%, and the reported conversion lifts are 17% and 19%. Because these are different outcomes, they should be read separately rather than averaged into one headline number.
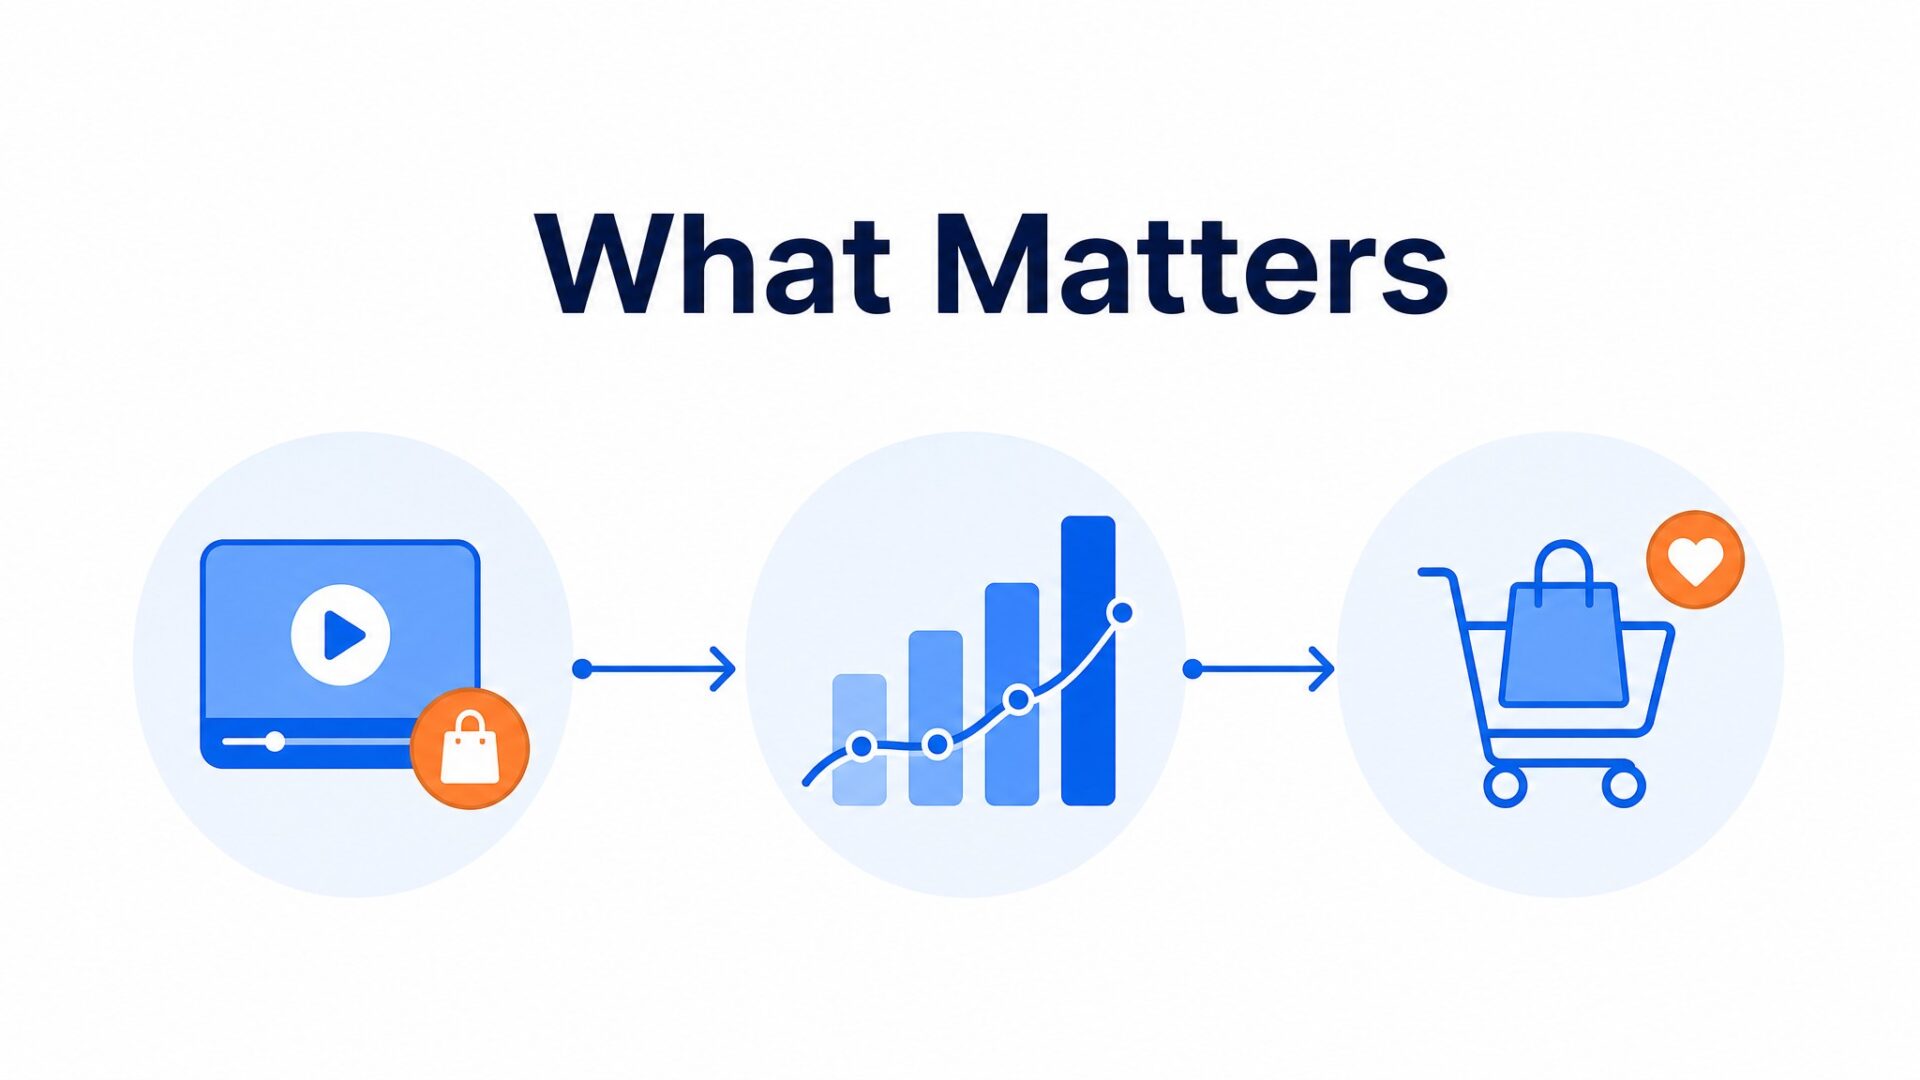
The individual cases are more useful than a blended average. Merchshark reports a 17% increased conversion rate. Frisør Sadon reports 42% more calls or bookings and 33% increased time on site. These figures describe those businesses, not a result every store should expect.
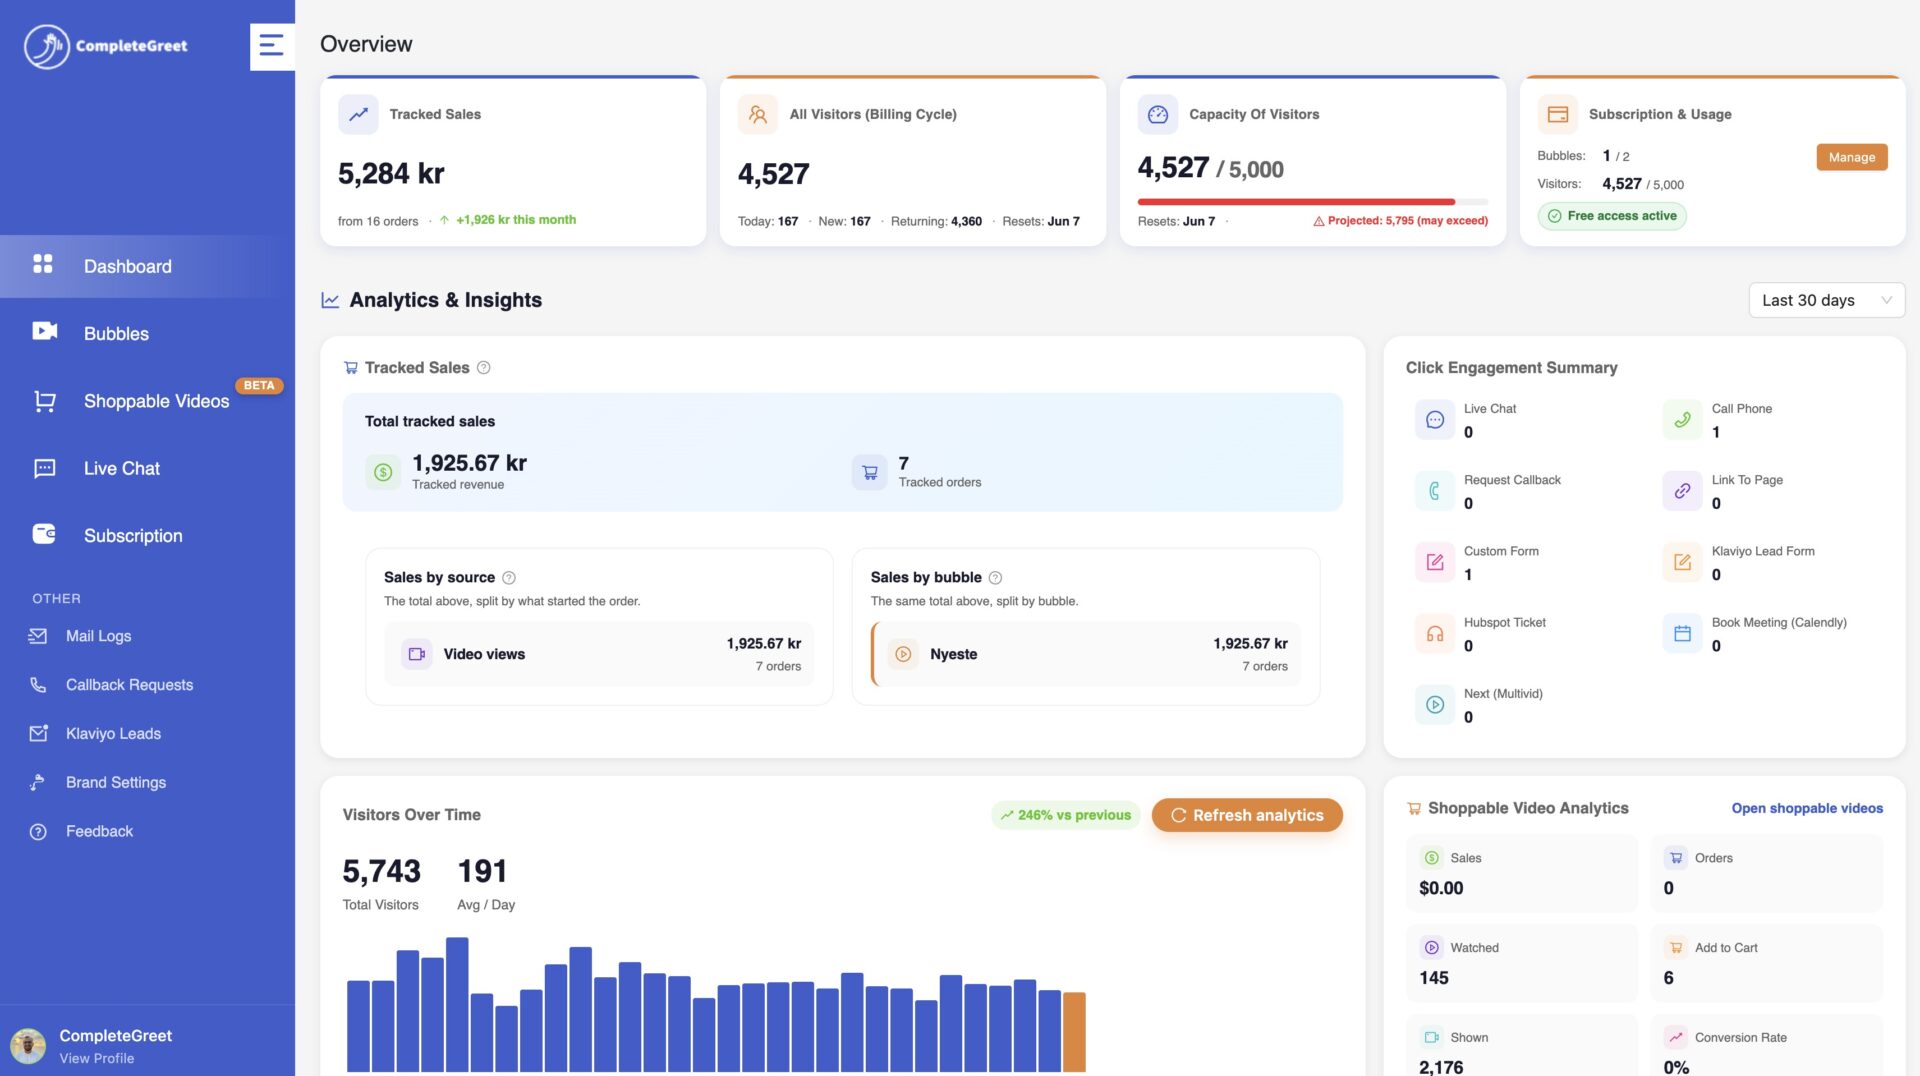
The data separates vanity metrics from revenue signals. Raw view counts can look impressive in dashboards but say little about purchase intent on their own. Watch time becomes more useful when you compare it with product clicks, add to cart actions, and purchases. Any engagement metric needs a business outcome beside it before you can judge the result.
It is easy to celebrate thousands of plays without checking how many turned into qualified leads. Revenue per visitor can answer the business question better than engagement time alone.
If your analytics setup separates video visitors from other traffic, compare revenue per visitor between the two groups. CompleteGreet’s shoppable video dashboard also tracks product clicks, add to cart actions, and attributed purchases, so those outcomes can be compared with views.
Which shoppable video metrics connect to revenue?
Video views, play rates, and click counts are useful, but they mean more when you connect them to purchases, bookings, or qualified leads. The useful metrics show whether a viewer who watched your product demo actually bought something, or if someone who clicked your call button ended up booking a consultation.
Review the shoppable video formats and shopping actions you want to measure before choosing your reporting setup.
CompleteGreet’s public cases use several outcome measures, so they should not be rolled into one average. Customer engagement, time on site, conversion rate, and calls or bookings are reported separately.
Reported time on site gains run from 21% to 33%. Merchshark reports a 17% increased conversion rate, while Frisør Sadon reports 42% more calls or bookings.
Those outcomes are closer to business results than a view count, although they are not the same as revenue.
A useful dashboard should place these outcomes next to the video that influenced them.
Setup teams can miss this during onboarding. They set the widget live, watch the view counter tick up, and call it a win. The useful work starts after that: mapping which products appear in which videos, tracking whether a product click leads to an add to cart action or purchase, and checking if visitors from paid ads behave differently from organic traffic.
Compare video views with product clicks and purchases. If many visitors open a video but few click a product, review the opening, pacing, and product match. Then check whether an edit changes clicks or purchases.
How to set up your first video greeting
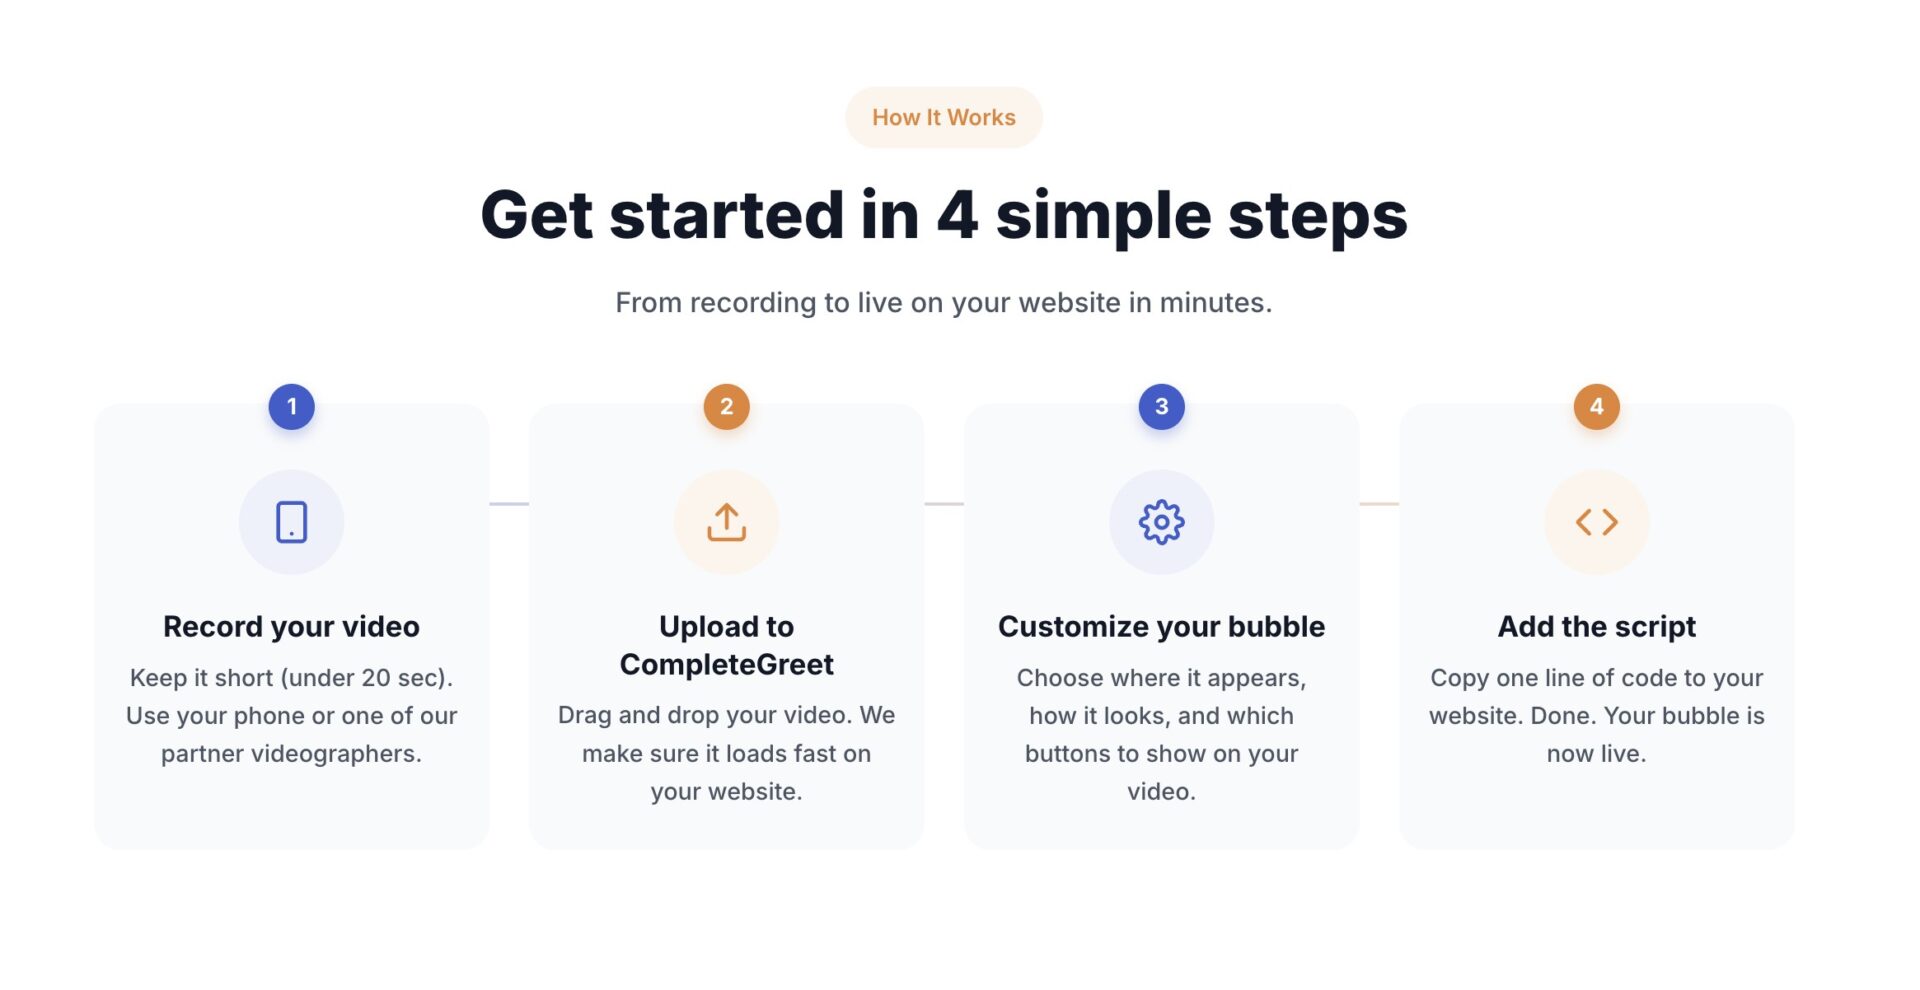
A basic video greeting is easier to record, upload, and publish when the message is already clear.
What to say (and what to skip)
Keep the greeting short. Open with your name and role, state the one thing you want visitors to do next, and end with a smile. You do not need to script every word. A sticky note with three bullet points can keep your eyes on the camera and your delivery natural.
First time recordings often run long because people try to explain everything. Put the value early, so visitors quickly understand why they should keep watching.
Where to place it
The bottom right corner is a practical default, provided it does not cover navigation, shopping carts, consent controls, or chat. On mobile, leave enough room around the bubble for the close button to be easy to tap.
Pricing pages and checkout flows are sensible places to test because visitors may have last minute questions. Measure whether the greeting helps rather than assuming it will reduce abandonment.
How to measure results
Track three numbers: play rate, click through rate, and inquiry volume. Play rate tells you if the thumbnail and placement draw attention. Click through rate shows whether your message prompts action. Inquiry volume matters most when those inquiries become qualified leads or sales.
CompleteGreet’s public cases report 42% more calls or bookings for Frisør Sadon and conversion lifts of 17% for Merchshark and 19% for Shopsmukkere. See the customer examples for the individual results.
Check the dashboard on a regular schedule, but avoid changing placement or script based on only a handful of visitors.
Start with one video on your highest traffic page. Scale from there.
An analytics dashboard is useful when its numbers lead to a decision.
The following section covers metrics that sit closer to a purchase, using events that CompleteGreet’s shoppable video dashboard can track.
The cost per product click formula
Calculate cost per product click by dividing your monthly platform fee by the product clicks attributed to video. For example, a $29 monthly fee divided by 750 product clicks is roughly 4 cents per click.
What to track instead of vanity metrics
Look beyond total views and focus on product clicks, add to cart actions, and attributed purchases from each video. If your site analytics can separate the groups, compare time on site for visitors who engage with video against your baseline traffic.
Mobile versus desktop splits
Review mobile and desktop results separately because visitor behavior may differ by device. Compare views and purchase actions rather than assuming one device always performs better.
Shorter videos may perform better for one product and worse for another. Compare views, product clicks, and purchases instead of assuming one length always wins.
Start by checking your dashboard for metrics that directly precede a purchase action. CompleteGreet’s shoppable video dashboard tracks clicks, add to cart actions, and attributed purchases.
Common questions
How much does CompleteGreet cost for shoppable video analytics?
CompleteGreet BUILD is $29 per month when billed yearly, or $36 month to month, for 5,000 unique visitors per month, 1 website, and 2 bubbles or videos. The plan includes basic click and view tracking. The pricing page says it counts one visit per unique IP within 24 hours.
Can I use CompleteGreet shoppable videos on my Shopify store?
Yes. CompleteGreet’s shoppable video feature supports Shopify and WooCommerce. Shopify stores can use the dedicated app, while WooCommerce stores can use the WordPress plugin. Other CompleteGreet video bubbles can be installed with a lightweight embed on other website platforms.
How long does it take to set up a shoppable video greeting?
Once the video and message are ready, the dashboard lets you upload or record a video, set the call to action button, and choose which pages display the bubble. Shopify and WordPress users can install through the dedicated app or plugin.
Which metrics actually matter for shoppable video success?
Product clicks, add to cart actions, and attributed purchases are the clearest shoppable video signals because they follow the path toward a sale. CompleteGreet’s public cases also report time on site gains of 21% to 33% and conversion lifts of 17% and 19% for individual implementations.
How many visitors can I track on the CompleteGreet BUILD plan?
The BUILD plan includes 5,000 unique visitors per month. The pricing page says it counts one visit per unique IP within 24 hours. GROWTH includes 10,000 unique visitors per month and 5 bubbles or videos.
What conversion lift can I expect from adding shoppable video?
Results vary by business. CompleteGreet’s case page reports a 17% increased conversion rate for Merchshark and a 19% conversion lift for Shopsmukkere. Frisør Sadon reports 42% more calls or bookings. These are individual case results, not a guaranteed range.
Does CompleteGreet work with React or Vue sites?
Yes. CompleteGreet can be added to React, Vue, or another site that accepts a lightweight embed. The script can load asynchronously so it does not block the initial HTML parse. Test page speed before and after installation on the actual site.